Market Outlook
October 10, 2018
Domestic Indices
Chg (%)
(Pts)
(Close)
Market Cues
BSE Sensex
(0.5)
(175)
34,299
Indian markets are likely to open flat tracking global indices and SGX Nifty.
Nifty
(0.5)
(47)
10,301
U.S. stocks fluctuated over the course of the trading day on Tuesday, extending the
Mid Cap
(0.2)
(21)
13,703
volatile performance seen in the previous session. The major averages spent the
Small Cap
(0.5)
(61)
13,501
session bouncing back and forth across the unchanged line before closing mixed for
Bankex
(0.5)
(130)
27,413
the second straight day. While the Dow Jones fell by 0.2% to 26,430, the Nasdaq
was flat at 7,738.
Global Indices
Chg (%)
(Pts)
(Close)
U.K. shares were little changed yesterday even as higher metal and crude prices
Dow Jones
(0.2)
(56)
26,430
helped lift commodity-related stocks. Brexit worries persisted with the Confederation
Nasdaq
0.0
2
7,738
of Business Industry demanding that Philip Hammond use the budget on 29 October
FTSE
0.1
4
7,238
to bolster investment by £3.5 billion to tackle Brexit uncertainty. The benchmark
Nikkei
(1.3)
(314)
23,469
FTSE 100 inched up by 0.1% to 7,238.
Hang Seng
(0.1)
(30)
26,172
On domestic front, Indian shares closed lower on Tuesday as oil prices resumed
Shanghai Com
0.2
5
2,721
their climb and the rupee gave up all early gains to hit a fresh record low of 74.27
in the afternoon, raising concerns about inflation and capital outflows. The BSE
Sensex dropped by 0.5% to 34,299.
Advances / Declines
BSE
NSE
Advances
527
299
News Analysis
Declines
2,128
1,480
Commercial paper borrowings spike in H1 FY19 as per RBI data
Unchanged
146
278
Detailed analysis on Pg2
Volumes (` Cr)
Investor’s Ready Reckoner
BSE
1,820
Key Domestic & Global Indicators
NSE
853
Stock Watch: Latest investment recommendations on 150+ stocks
Refer Pg5 onwards
Net Inflows (` Cr)
Net
Mtd
Ytd
Top Picks
FII
(1,077)
(1,418)
(6,857)
CMP
Target
Upside
Company
Sector
Rating
*MFs
1,125
3,967
80,584
(`)
(`)
(%)
Blue Star
Capital Goods
Buy
547
867
58.5
Dewan Housing Finance
Financials
Buy
244
555
127.5
Top Gainers
Price (`)
Chg (%)
Parag Milk Foods
Others
Buy
233
410
76.0
111
13.8
Bata India
Others
Buy
864
1,243
43.9
84
9.4
KEI Industries
Capital Goods
Buy
282
486
72.3
More Top Picks on Pg4
DHFL
244
9.2
79
7.8
Key Upcoming Events
58
6.9
Previous
Consensus
Date
Region
Event Description
ReadingExpectations
Oct 10, 2018 UK
Industrial Production (YoY)
0.90
Top Losers
Price (`)
Chg (%)
Oct 10, 2018 US
Consumer price index (mom)
0.20
184
-13.4
Oct 11, 2018 India
RBI Cash Reserve ratio
4.00
Oct 12, 2018 India
Industrial Production YoY
6.60
101
-12.4
Oct 12, 2018 China
Exports YoY%
9.80
24
-9.9
More Events on Pg7
425
-9.7
511
-8.8
As on Oct 09, 2018
Market Outlook
October 10, 2018
News Analysis
Commercial paper borrowings spike in H1 FY19 as per RBI data
The Reserve Bank of India’s (RBI’s) Monetary Policy Report for October 2018 shows
that funding from non-bank sources to the commercial sector was more than ₹ 5.6
trillion between April and 14 September. In contrast, the central bank’s Weekly
Statistical Supplement shows that total non-food credit growth by banks in the
current fiscal year up to 14 September was ₹ 1.66 trillion. A large chunk of that
amount will be personal lending, while farm loans will also be part of it.
During H1FY19, ₹ 2.53 trillion or a bit less than half of the total borrowings from
non-banks, was in commercial paper. For the last fiscal year up to mid-March,
commercial papers accounted for just 6.2% of the funding by non-bank sources,
with the largest chunk (17%) being private placements. This dependence on short-
term commercial paper for funds is alright if it was for working capital, but the
suspicion is, as in the case of Infrastructure Leasing and Financial Services Ltd
(IL&FS), these short-term funds are being used to fund long-term assets. The
dependence on commercial papers as a source of funds also explains the fear in
the market after the IL&FS implosion.
RBI’s latest financial stability report pointed out that “AMC-MFs were quite active in
the money markets (particularly commercial paper and certificate of deposits
markets) with about 45% of their receivables being short-term in nature”. That
accounts for the panic in mutual funds when there were large-scale redemptions
from liquid funds. Note though, that the chart shows funding from non-banking
financial companies (NBFCs) was much lower in the first half of FY19.
The financial stability report also said that as of March 2018, 22% of total
borrowings of NBFCs were short-term in nature, with commercial papers
accounting for more than half of these short-term funds. Given that the latest data
is showing a spike in funding from commercial papers in the first half of FY19, it is
likely that the share of commercial papers has increased after March.
Economic and Political News
Finance ministry to recast direct tax panel after discord on suggestions
RBI to inject Rs 120 bn into system on Oct 11 to manage liquidity
Bank unions stage protest against BoB-Vijaya Bank-Dena Bank merger
84 railway projects worth Rs 990 billion on cards to boost coal traffic
Corporate News
IL&FS, NHAI may reach out-of-court settlement on select highway projects
Jet Privilege stake sale struggles to take flight
Russia's VTB likely to seek solo bid for debt-laden Essar Steel in court
1,600 combination drugs under govt lens, may face ban over safety issues
Suresh Prabhu reviews road map of debt-laden Air India with chief Kharola
Market Outlook
October 10, 2018
Quarterly Bloomberg Brokers Consensus Estimate
ZEEL - October 10, 2018
Particulars (` cr)
2QFY19E
2QFY18
y-o-y (%)
1QFY19
q-o-q (%)
Sales
1,848
1,582
16.8
1,772
4.2
EBIDTA
577
476
21.2
544
6.1
%
31.2
30
31
PAT
400
591
(32.3)
326
22.7
TCS - October 11, 2018
Particulars (` cr)
2QFY19E
2QFY18
y-o-y (%)
1QFY19
q-o-q (%)
Sales
36,503
30,541
19.5
34,261
6.5
EBIDTA
10,107
8,164
23.8
9,071
11.4
%
27.7
27
26
PAT
7,929
6,460
22.7
7,362
7.7
HUL - October 12, 2018
Particulars (` cr)
2QFY19E
2QFY18
y-o-y (%)
1QFY19
q-o-q (%)
Sales
9,323
8,309
12.2
9,487
(1.8)
EBIDTA
2,020
1,672
20.8
2,192
(7.8)
%
21.7
20
23
PAT
1,484
1,276
16.3
1,529
(2.9)
Indiabull Housing Finance - October 15, 2018
Particulars (` cr)
2QFY19E
2QFY18
y-o-y (%)
1QFY19
q-o-q (%)
PAT
1,099
852
28.9
1,049
4.7
Market Outlook
October 10, 2018
Top Picks
Market Cap
CMP
Target
Upside
Company
Rationale
(` Cr)
(`)
(`)
(%)
Favorable outlook for the AC industry to augur well
for Cooling products business which is out pacing
Blue Star
5,268
547
867
58.5
the market growth. EMPPAC division's profitability
to improve once operating environment turns
around.
With a focus on the low and medium income (LMI)
consumer segment, the company has increased its
Dewan Housing Finance
7,669
244
555
127.5
presence in tier-II & III cities where the growth
opportunity is immense.
Well capitalized with CAR of 18.1% which gives
sufficient room to grow asset base. Faster
ICICI Bank
1,96,466
305
416
36.4
resolution of NPA would reduce provision cost,
which would help to report better ROE.
High order book execution in EPC segment, rising
KEI Industries
2,217
282
486
72.3
B2C sales and higher exports to boost the revenues
and profitability
Expected to benefit from the lower capex
Music Broadcast Limited
1,859
326
475
45.7
requirement and 15 year long radio broadcast
licensing.
Strong brands and distribution network would
Siyaram Silk Mills
1,757
375
752
100.5
boost growth going ahead. Stock currently trades
at an inexpensive valuation.
GST regime and the Gujarat plant are expected to
Maruti Suzuki
2,01,182
6,659
10,820
62.5
improve the company’s sales volume and margins,
respectively.
We expect loan book to grow at 24.3% over next
GIC Housing
1,246
231
486
110.4
two year; change in borrowing mix will help in NIM
improvement
Third largest brand play in luggage segment
Increased product offerings and improving
Safari Industries
1,533
688
1,071
55.7
distribution network is leading to strong growth in
business. Likely to post robust growth for next 3-4
years
We expect financialisation of savings and
Aditya Birla Capital
22,960
104
198
90.4
increasing penetration in Insurance & Mutual fund
would ensure steady growth.
One of the leading Indian dairy products
companies in India created strong brands in dairy
products. Rising revenue share of high-margin
Parag Milk Foods
1,964
233
410
76.0
Value Added Products and reduction in interest cost
is likely to boost margins and earnings in next few
years.
HDFC Bank maintained its steady growth in the
4QFY18. The bank’s net profit grew by 20.3%.
Steady growth in interest income and other income
HDFC Bank
5,29,237
1,947
2,350
20.7
aided PAT growth. The Strong liability franchise
and healthy capitalisation provides strong earning
visibility. At the current market price, the bank is
trading at 3.2x FY20E ABV.
Source: Company, Angel Research
Market Outlook
October 10, 2018
Continued...
Market Cap
CMP
Target
Upside
Company
Rationale
(` Cr)
(`)
(`)
(%)
We expect strong PAT growth on back of
healthy growth in automobile segment (on back
of new launches and facelifts in some of the
M&M
94,849
762
1,050
37.8
model ) and strong growth in Tractors segment
coupled by its strong brand recall and
improvement in rural sentiment
Market leader in the room air conditioner (RAC)
outsourced manufacturing space in India with a
market share of
55.4%. It is a one-stop
Amber Enterprises
2,751
875
1,230
40.6
solutions provider for the major brands in the
RAC industry and currently serves eight out of
the 10 top RAC brands in India
BIL is the largest footwear retailer in India,
offering footwear, accessories and bags across
brands. We expect BIL to report net PAT CAGR
of
~16% to
~`3115cr over FY2018-20E
Bata India
11,104
864
1,243
43.9
mainly due to new product launches, higher
number of stores addition and focus on
women’s high growth segment and margin
improvement
SHTF is in the sweet spot with benefits from
stronger CV volumes, NIMs unaffected by rising
Shriram Transport Finance
21,627
953
1,764
85.1
bond yields on the back of stronger pricing
power and an enhancing ROE by 750bps over
FY18-20E, supported by decline in credit cost.
We expect JSPL’s top line to grow at 27% CAGR
over FY19-FY20 on the back of strong steel
demand and capacity addition. On the bottom
Jindal Steel & Power Limited
16,798
173
327
89.0
line front, we expect JSPL to turn in to profit by
FY19 on back of strong operating margin
improvement.
GMM Pfaudler Limited (GMM) is the Indian
market leader in glass-lined (GL) steel
equipment. GMM is expected to cross CAGR
GMM Pfaudler Ltd
1,403
960
1,287
34.1
15%+ in revenue over the next few years
mainly led by uptick in demand from user
industries and it is also expecting to increase its
share of non-GL business to 50% by 2020.
Aurobindo Pharmaceuticals, amongst the
Indian Pharmaceutical companies, is well
placed to face the challenging generic markets,
given its focus on achieving growth through
Aurobindo Pharmaceuticals
44,769
764
870
13.9
productivity. Aurobindo will report net revenue
& net profit CAGR of ~13% & ~8% resp.
during FY2018-20E. Valuations are cheap V/s
its peers and own fair multiples of 17-18x.
Well planned strategy to grow small business
loans and cross-selling would propel fees
Yes Bank
51,981
225
365
62.2
income. We expect YES to grow its advance
much higher than industry and improvement in
asset quality to support profitability.
We believe advance to grow at a healthy CAGR
of 35% over FY18-20E. Below peers level ROA
RBL Bank
21,057
496
690
39.1
(1.2% FY18) to expand led by margin
expansion and lower credit cost.
TTK Prestige has emerged as one of the leading
brands in kitchen appliances in India after its
successful transformation from a single product
TTK Prestige
6,786
5,825
8,200
40.8
company to offering an entire gamut of home
and kitchen appliances. We are expecting a
CAGR of 18% in revenue and 25% in PAT over
FY2018-20.
Source: Company, Angel Research
Market Outlook
October 10, 2018
Continued...
Market Cap
CMP
Target
Upside
Company
Rationale
(` Cr)
(`)
(`)
(%)
We expect Inox Wind to report exponential
growth in top-line and bottom-line over FY19-
20E. The growth would be led by changing
renewable energy industry dynamics in favor of
Inox Winds
1,662
75
127
69.3
wind energy segment viz. changes in auction
regime from Feed-In-Tariff (FIT) to reverse
auction regime and Government’s guidance for
10GW auction in FY19 and FY20 each.
Considering the strong CV demand due to
change in BS-VI emission norms (will trigger
pre-buying activities), pick up in construction
Ashok Leyland
32,320
110
156
41.8
activities and no significant impact on industry
due to recent axle load norms, we recommend
BUY on Ashok Leyland at current valuations.
Source: Company, Angel Research
Fundamental Call
Market Cap
CMP
Target
Upside
Company
Rationale
(` Cr)
(`)
(`)
(%)
CCL is likely to maintain the strong growth
CCL Products
3,259
245
360
46.9
trajectory over FY18-20 backed by capacity
expansion and new geographical foray
We forecast Nilkamal to report top-line CAGR of
~9% to `2,635cr over FY17-20E on the back of
Nilkamal
2,269
1,521
2,178
43.2
healthy demand growth in plastic division. On the
bottom-line front, we estimate
~10% CAGR to
`162cr owing to improvement in volumes.
Elantas Beck India is the Indian market leader in
liquid insulation segment used in electrical
equipments like motors, transformers etc. It derives
Elantas Beck India Ltd
1,490
1,880
2,500
33.0
demand from several industries which are expected
to register 10%+ CAGR in demand in the coming
years.
Greenply Industries Ltd (GIL) manufactures plywood
& allied products and medium density fibreboards
(MDF). GIL to report net revenue CAGR of ~14% to
Greenply Industries
1,724
140
256
82.9
~`2,478cr over FY2017-20E mainly due to healthy
growth in plywood & lamination business on the
back of strong brand and distribution network
L&T Fin’s new management is on track to achieve
L&T Finance Holding
23,935
123
210
70.7
ROE of 18% by 2020 and recent capital infusion of
`3000cr would support advance growth.
Market Outlook
October 10, 2018
Key Upcoming Events
Global economic events release calendar
Bloomberg Data
Date
Time Country
Event Description
Unit
Period
Last Reported
Estimated
Oct 10, 2018
2:00 PMUK
Industrial Production (YoY)
% Change
Aug
0.90Oct 10, 2018
6:00 PMUS
Consumer price index (mom)
% Change
Sep
0.20
Oct 11, 2018
2:30 PMIndia
RBI Cash Reserve ratio
%
Oct 5
4.00Oct 11, 2018
Oct 12, 2018
5:30 PMIndia
Industrial Production YoY
% Change
Aug
6.60Oct 12, 2018
China
Exports YoY%
% Change
Sep
9.80
Oct 16, 2018
0-Jan-00UK
Jobless claims change
Thousands
Sep
8.70Oct 16, 2018
0-Jan-00China
Consumer Price Index (YoY)
% Change
Sep
2.30
Oct 19, 2018
0-Jan-00China
Real GDP (YoY)
% Change
3Q
6.70Oct 19, 2018
Oct 25, 2018
0-Jan-00Euro Zone ECB announces interest rates
%
Oct 25
-Oct 25, 2018
Oct 30, 2018
0-Jan-00
Euro ZoneEuro-Zone GDP s.a. (QoQ)
% Change
3Q A
0.40Oct 30, 2018
Nov 01, 2018
0-Jan-00
UKBOE Announces rates
% Ratio
Nov 1
0.75Nov 01, 2018
Nov 14, 2018
0-Jan-00
GermanyGDP nsa (YoY)
% Change
3Q P
2.30Nov 14, 2018
Source: Bloomberg, Angel Research
Market Outlook
October 10, 2018
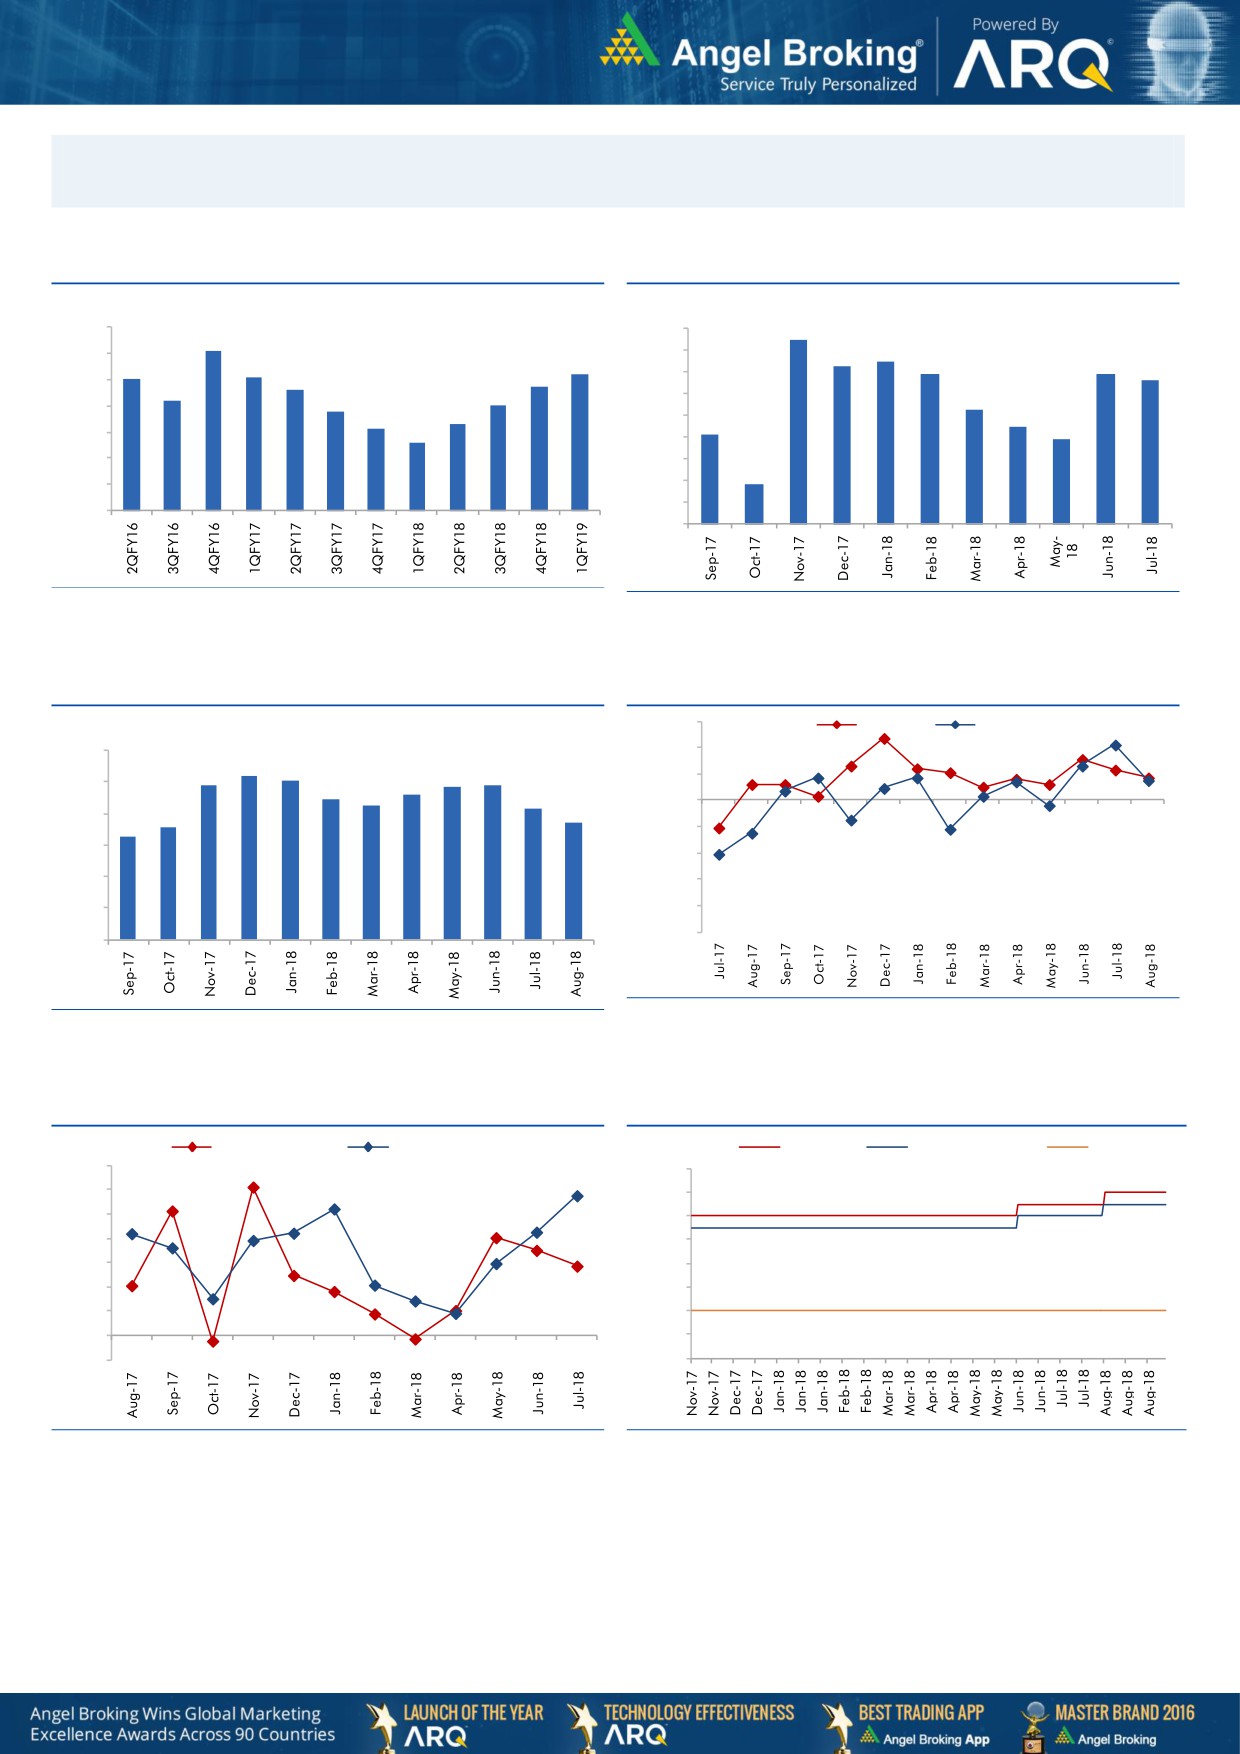
Macro watch
Exhibit 1: Quarterly GDP trends
Exhibit 2: IIP trends
(%)
(%)
10.0
9.0
8.5
9.1
8.0
7.3
7.5
9.0
8.2
6.9
6.9
8.0
8.1
6.6
7.6
7.7
7.0
8.0
7.2
6.8
7.0
6.0
5.3
7.0
6.3
4.5
6.1
5.0
4.1
5.6
3.9
6.0
4.0
5.0
3.0
1.8
4.0
2.0
1.0
3.0
-
Source: CSO, Angel Research
Source: MOSPI, Angel Research
Exhibit 3: Monthly CPI inflation trends
Exhibit 4: Manufacturing and services PMI
56.0
Mfg. PMI
Services PMI
(%)
6.0
54.0
5.2
5.1
4.9
4.9
4.9
4.6
52.0
5.0
4.4
4.3
4.2
50.0
3.6
3.7
4.0
3.3
48.0
3.0
46.0
2.0
44.0
1.0
42.0
40.0
-
Source: Market, Angel Research; Note: Level above 50 indicates expansion
Source: MOSPI, Angel Research
Exhibit 5: Exports and imports growth trends
Exhibit 6: Key policy rates
(%)
Exports yoy growth
Imports yoy growth
(%)
Repo rate
Reverse Repo rate
CRR
35.0
7.00
30.0
6.50
25.0
6.00
20.0
5.50
15.0
5.00
10.0
4.50
5.0
4.00
0.0
3.50
(5.0)
3.00
Source: Bloomberg, Angel Research
Source: RBI, Angel Research
Market Outlook
October 10, 2018
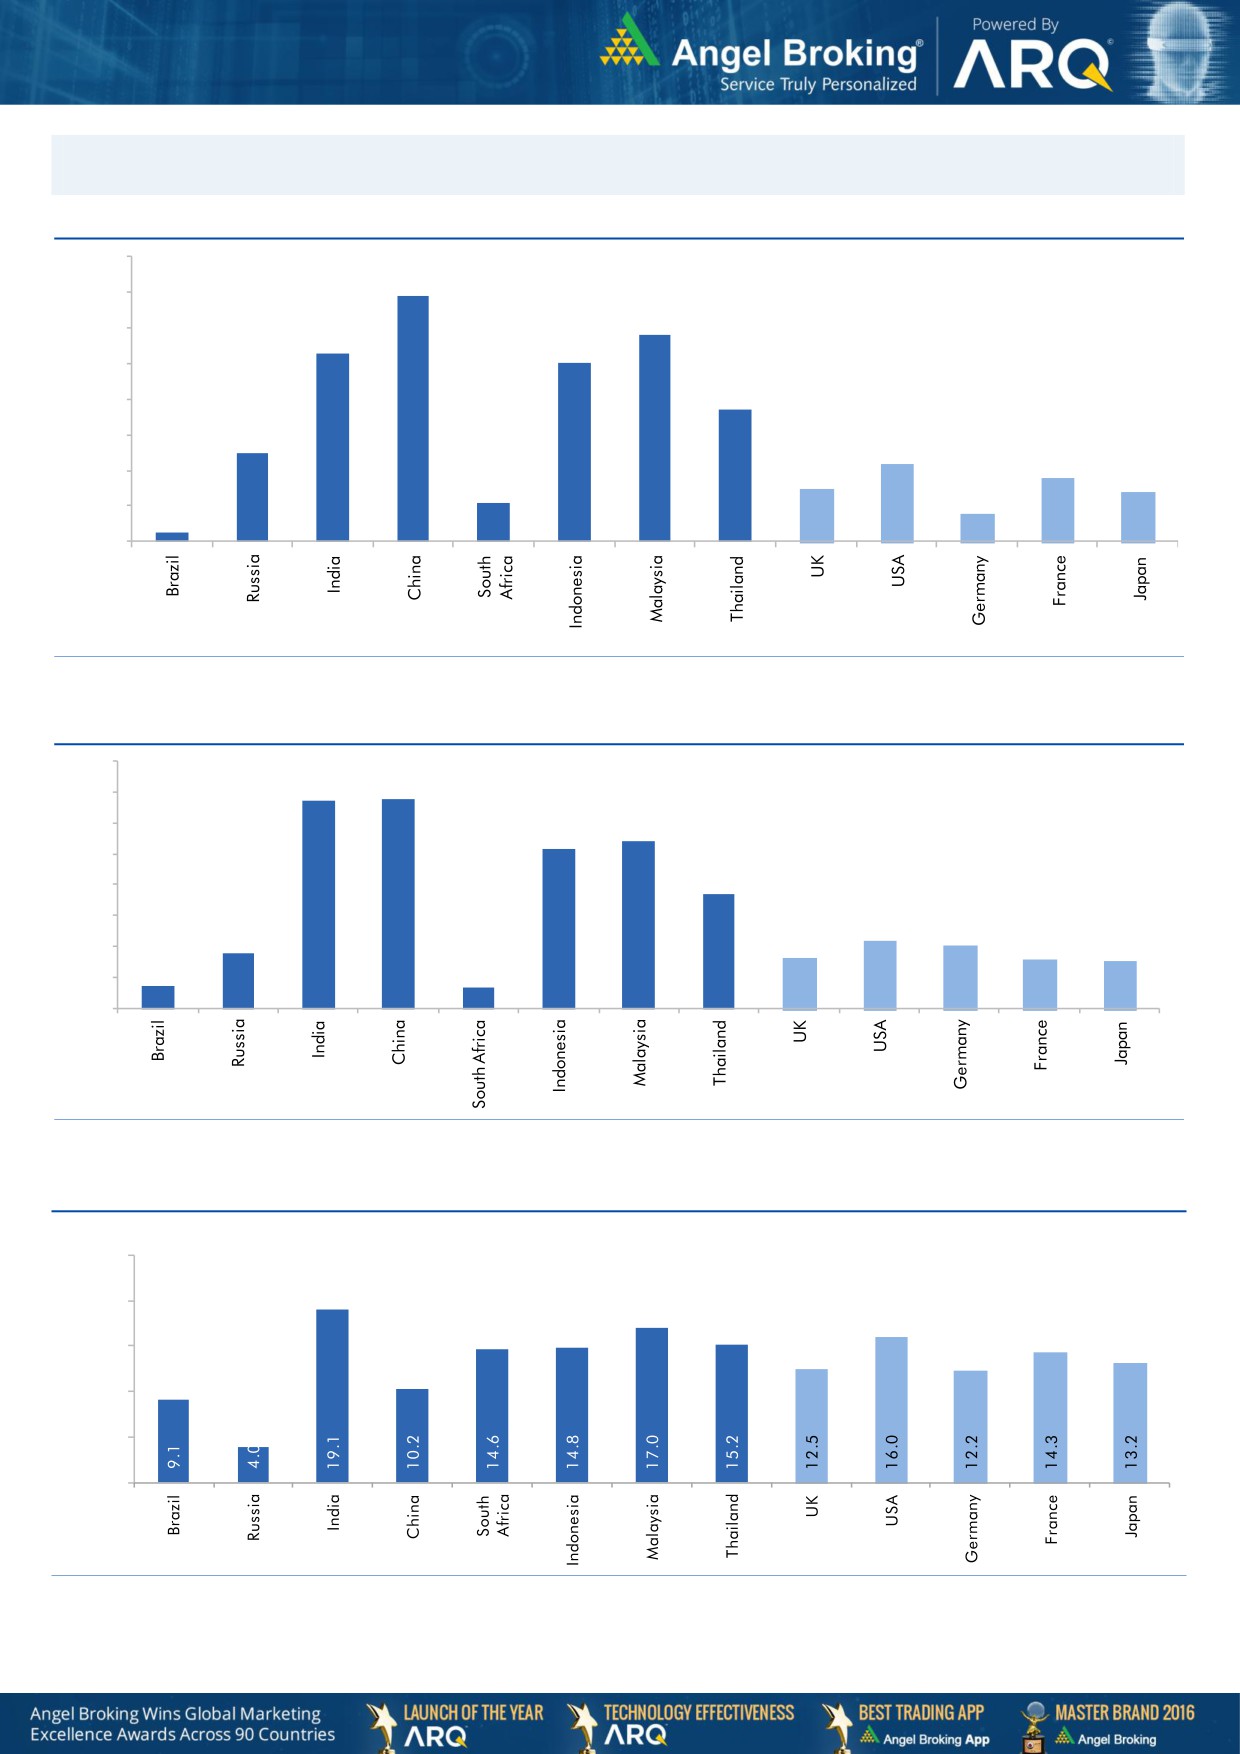
Global watch
Exhibit 1: Latest quarterly GDP Growth (%, yoy) across select developing and developed countries
8.0
(%)
6.9
7.0
5.8
6.0
5.3
5.0
5.0
1.1
3.7
4.0
2.5
3.0
2.2
1.8
2.0
1.5
1.4
0.8
1.0
0.3
-
Source: Bloomberg, Angel Research
Exhibit 2: 2017 GDP Growth projection by IMF (%, yoy) across select developing and developed countries
(%)
6.7
6.8
7.0
6.0
5.4
5.2
5.0
3.7
4.0
3.0
1.8
2.2
2.0
1.7
1.6
1.5
2.0
0.7
0.7
1.0
-
Source: IMF, Angel Research
Exhibit 3: One year forward P-E ratio across select developing and developed countries
(x)
25.0
20.0
15.0
10.0
5.0
-
Source: IMF, Angel Research
Market Outlook
October 10, 2018
Exhibit 4: Relative performance of indices across globe
Returns (%)
Country
Name of index
Closing price
1M
3M
1YR
Brazil
Bovespa
75,429
(4.0)
5.6
2.7
Russia
Micex
4,327
1.4
7.1
11.4
India
Nifty
11,515
0.7
6.1
14.1
China
Shanghai Composite
2,682
(1.5)
(11.3)
(20.8)
South Africa
Top 40
50,441
1.7
(1.7)
1.9
Mexico
Mexbol
49,612
2.2
6.3
(1.0)
Indonesia
LQ45
937
(2.7)
(2.6)
(4.7)
Malaysia
KLCI
1,804
(0.1)
1.6
1.7
Thailand
SET 50
1,136
2.5
0.7
9.9
USA
Dow Jones
26,155
3.4
3.9
17.5
UK
FTSE
7,304
(4.0)
(4.3)
0.7
Japan
Nikkei
23,095
4.0
1.1
19.8
Germany
DAX
12,124
(0.3)
(5.5)
(3.2)
France
CAC
5,353
0.9
(1.8)
2.1
Source: Bloomberg, Angel Research As of 25 Sep, 2018
Market Outlook
October 10, 2018
Exhibit 7: Historical Angel Top Picks/Fundamental Calls
Date Added
Top Picks/Fundamental
Stocks
Reco Price
Target/Revised Price
Current Status
17-08-2018
Top Picks
Ashok Leyland
128
156
Open
10-08-2018
Top Picks
Inox Wind
107
127
Open
31-08-2018
Top Picks
TTK Prstige
7,235
8,200
Open
09-08-2018
Top Picks
TTK Prstige
6,206
7,500
06-07-2018
Top Picks
Aurobindo Pharma
603
780
Open
30-08-2018
Top Picks
RBL Bank
626
690
Open
06-07-2018
Top Picks
RBL Bank
565
670
06-07-2018
Top Picks
Yes Bank
348
418
Open
30-06-2018
Top Picks
Jindal Steel & Power
222
350
Open
20-06-2018
Top Picks
Shriram Transport Finance Com
1,466
1,764
Open
30-07-2018
Top Picks
Bata India
918
1,007
Open
23-07-2018
Top Picks
Bata India
842
955
01-07-2018
Top Picks
Bata India
862
948
18-06-2018
Top Picks
Bata India
779
896
14-06-2018
Top Picks
Amber Enterprises
1,026
1,230
Open
07-06-2018
Top Picks
M&M
918
1050
Open
04-05-2018
Top Picks
M&M
860
990
03-05-2018
Fundamental
L&T Finance Holding
171
210
Open
02-05-2018
Top Picks
HDFC Bank
1944
2315
Open
04-05-2018
Top Picks
Matrimony.com Ltd
573
1016
Closed(17/08/2018)
20-04-2018
Top Picks
Matrimony.com Ltd
781
984
15-05-2018
Top Picks
Parag Milk Foods Limited
310
410
Open
16-04-2018
Top Picks
Parag Milk Foods Limited
249
333
27-08-2018
Top Picks
GMM Pfaudler Limited
1,170
1,287
Open
18-08-2018
Top Picks
GMM Pfaudler Limited
1,024
1,200
07-08-2018
Top Picks
GMM Pfaudler Limited
984
1,100
29-06-2018
Fundamental
GMM Pfaudler Limited
932
1,020
14-05-2018
Fundamental
GMM Pfaudler Limited
818
900
06-04-2018
Fundamental
GMM Pfaudler Limited
712
861
07-03-2018
Fundamental
Ashok Leyland Ltd
139
163
Closed (26/04/2018)
03-03-2018
Fundamental
Greenply Industries
340
395
Open
27-08-2018
Top Picks
Safari Industries
974
1,071
Open
14-08-2018
Top Picks
Safari Industries
868
1,000
07-08-2018
Top Picks
Safari Industries
788
870
16-07-2018
Top Picks
Safari Industries
693
800
16-04-2018
Top Picks
Safari Industries
651
750
21-02-2018
Top Picks
Safari Industries
532
650
31-05-2018
Top Picks
HSIL Ltd
348
Closed (31/05/2018)
16-02-2018
Top Picks
HSIL Ltd
433
510
07-02-2018
Fundamental
Elantas Beck India Ltd.
2155
2500
Open
01-02-2018
Top Picks
ICICI Bank
352
416
Open
01-02-2018
Top Picks
Aditya Birla Capital
167
218
Open
04-01-2018
Fundamental
CCL Products
278
360
Open
03-01-2018
Fundamental
Nilkamal Ltd
1880
2178
Open
01-01-2018
Fundamental
Capital First Ltd
693
850
Closed (15/01/2018)
30-12-2017
Fundamental
Shreyans Industries Ltd
205
247
Closed
Source: Company, Angel Research
Market Outlook
October 10, 2018
Exhibit 8: Historical Angel Top Picks/Fundamental Calls
Date Added
Top Picks/Fundamental
Stocks
Reco Price
Target/Revised Price
Current Status
Fundamental
Prism Cement Ltd
160
Closed (09/05/2018)
21-12-2017
Fundamental
Prism Cement Ltd
118
131
18-12-2017
Fundamental Menon Bearings Limited
92
114
Closed (17/01/2018)
14-12-2017
Top Picks
Ruchira Papers Ltd.
188
244
Closed (09/02/2018)
17-05-2018
Top Picks
Century Plyboards India
280
Closed(17/05/2018)
28-11-2017
Top Picks
Century Plyboards India
317
400
19-12-2017
Top Picks
LT Foods
85
Closed(18/06/2018)
06-11-2017
Top Picks
LT Foods
74
96
16-10-2017
FundamentalEndurance Technologies Ltd
1111
1277
Closed (01/12/2017)
11-09-2017
Top Picks
GIC Housing
533
655
Open
10-10-2017
Top Picks
Music Broadcast Limited
404
475
Open
20-07-2017
Top Picks
Music Broadcast Limited
368
434
07-07-2017
Fundamental L&T Finance Holdings Ltd
149
179
Closed (28/8/2017)
06-07-2017
Fundamental
Syngene International
478
564
Closed (1/3/2018)
05-07-2017
Top Picks
Maruti
7371
10619
Open
05-06-2017
Top Picks
Karur Vysya Bank
127
100
Closed (12/03/2018)
23-05-2018
Top Picks
KEI Industries
481
589
Open
04-01-2017
Top Picks
KEI Industries
125
485
31-05-2018
Top Picks
Alkem Lab
1978
Closed (31/05/2018)
01-12-2016
Top Picks
Alkem Lab
1700
2441
17-10-2016
Top Picks
Asian Granito
267
534
Closed (18/02/2018)
17-05-2018
Top Picks
TV Today Network
460
Closed (17/05/2018)
04-08-2016
Top Picks
TV Today Network
297
603
05-04-2016
Top Picks
DHFL
189
720
Open
25-06-2018
Top Picks
Navkar Corporation
207
Closed(25/06/2018)
05-01-2016
Top Picks
Navkar Corporation
207
265
Open
08-12-2015
Top Picks
Blue Star
357
867
Open
30-10-2015
Top Picks
Siyaram Silk Mills
186
851
Open
Source: Company
Market Outlook
October 10, 2018
Research Team Tel: 022 - 39357800
DISCLAIMER:
Angel Broking Limited (hereinafter referred to as “Angel”) is a registered Member of National Stock Exchange of India Limited, Bombay
Stock Exchange Limited, Metropolitan Stock Exchange Limited, Multi Commodity Exchange of India Ltd and National Commodity &
Derivatives Exchange Ltd It is also registered as a Depository Participant with CDSL and Portfolio Manager and Investment Adviser with
SEBI. It also has registration with AMFI as a Mutual Fund Distributor. Angel Broking Limited is a registered entity with SEBI for Research
Analyst in terms of SEBI (Research Analyst) Regulations, 2014 vide registration number INH000000164. Angel or its associates has not
been debarred/ suspended by SEBI or any other regulatory authority for accessing /dealing in securities Market. Angel or its
associates/analyst has not received any compensation / managed or co-managed public offering of securities of the company covered
by Analyst during the past twelve months.
This document is solely for the personal information of the recipient, and must not be singularly used as the basis of any investment
decision. Nothing in this document should be construed as investment or financial advice. Each recipient of this document should make
such investigations as they deem necessary to arrive at an independent evaluation of an investment in the securities of the companies
referred to in this document (including the merits and risks involved), and should consult their own advisors to determine the merits and
risks of such an investment.
Reports based on technical and derivative analysis center on studying charts of a stock's price movement, outstanding positions and
trading volume, as opposed to focusing on a company's fundamentals and, as such, may not match with a report on a company's
fundamentals. Investors are advised to refer the Fundamental and Technical Research Reports available on our website to evaluate the
contrary view, if any
The information in this document has been printed on the basis of publicly available information, internal data and other reliable
sources believed to be true, but we do not represent that it is accurate or complete and it should not be relied on as such, as this
document is for general guidance only. Angel Broking Limited or any of its affiliates/ group companies shall not be in any way
responsible for any loss or damage that may arise to any person from any inadvertent error in the information contained in this report.
Angel Broking Limited has not independently verified all the information contained within this document. Accordingly, we cannot testify,
nor make any representation or warranty, express or implied, to the accuracy, contents or data contained within this document. While
Angel Broking Limited endeavors to update on a reasonable basis the information discussed in this material, there may be regulatory,
compliance, or other reasons that prevent us from doing so.
This document is being supplied to you solely for your information, and its contents, information or data may not be reproduced,
redistributed or passed on, directly or indirectly.
Neither Angel Broking Limited, nor its directors, employees or affiliates shall be liable for any loss or damage that may arise from or in
connection with the use of this information.